The PLT, Lazy vs Eager binding, and everything in between
Prologue
There are many posts out there explaning this mechanism, and while they are good, most of them focus on the exploitation part of the PLT and GOT and thus don’t explain glibc’s role in the process My goal here isn’t to explain the whole implementation of this mechanism in glibc, but rather provide key insights and direction to give a detailed yet overally complicated understanding of the process.
Any assembly here will be x86_64 AT&T syntax, but it’s the same gist for different architectures as well.
PLT + GOT explained in a nutshell
The PLT, GOT and GOT.PLT are all sections in an ELF file.
- The PLT is a table of entries, each entry being a very short code snippet (often times called stub).
- The GOT is also a table of entries, each entry being a an address to some symbol (could be function, global variable, etc).
- The GOT.PLT is simply the part of the GOT which the PLT uses.
Usually when we call a function, we use call <address of function we want to call>.
NOTE: the operand for
calldoesn’t have to be a hardcoded address. It might be the offset fromRIP, maybe we use the value in some register as address, etc. Either way, it’s the same gist - we push the currentRIPto the stack and jump directly to the specified address.
Over all simple.
Well, it’s not always the case. Calling functions which utilize the PLT looks a bit different:
- instead of
calling straight to the address of the function we want to execute, wecallto the address of some PLT entry. - the PLT entry, contains a
jmpinstruction to another address - a GOT.PLT entry - the GOT.PLT entry contains the actual address of the function we wanted to call.
NOTE: as you’ll see for yourself very soon, usually the PLT stub has additional code, not just a single
jmpinstruction to the desired GOT.PLT entry. We’ll get to that in a bit.
Motivation
The first time I’ve come across this mechanism the first thing I asked myself “Isn’t this just overcomplicating things?”. At first glance it does seem a bit complicated, but there are good reasons for it:
- In case a relocation must be applied (for example when the function is implemented by a shared object) instead of applying relocations straight to the
.textsection in every place the function is called, you apply it once in the GOT, and you’re good to go! This way you can share the same code between different processes instead of having to load and apply relocations for each process separately. - Using different versions of functions - sometimes, the developer wants to call a different function depending on what version, architecture, OS, etc
the user is rocking. That way the dynamic linker can choose which address to replace the GOT with, depending on what function should be called (this is what happens in a lot of glibc functions, like
printffor example) - Lets the linker use a technique called lazy binding.
Wha’ts lazy binding you ask?
Lazy vs eager binding in a nutshell
Lazy binding and eager binding are different methods to apply relocations (binding function calls to their actual address)
In eager binding, the linker resolves the relocations before transfaring control to the program. In lazy binding, (as the name implies) the linker does this lazily - he doesn’t initially resolve the relocations, but instead it resolves a relocation at runtime, when the program tries to use the symbol associated with that relocation.
The reason lazy binding was introduced was because in large applications, applying all relocations before running could be very time consuming, which would result in quite a big delay until the program actually runs. On the other hand, applying relocations at runtime results in a decrease of total execution speed + an increase in code size (as you’ll see later, the PLT stubs become larger than a simple jmp, we need to add PLT resolver stubs, etc)
Glibc uses lazy binding by default (unless specified otherwise to the dynamic linker), but in contrast Google chose to have Android’s libc use eager binding.
There isn’t one truth, and each method is better for different scenarios depending on the programs priority and requirements.
In action
Let’s get our hands dirty! Consider the following C program:
/* prog.c */
#include <stdio.h>
#include <stdlib.h>

int main(void) {
  int *ptr = (int *)malloc(10 * sizeof(int));
  for (int i = 0; i < 10; i++) {
    printf("%d\n", i);
    ptr[i] = i;
  }

  return 0;
}
A simple trivial program, which allocates memory for 10 integers, moves over the array and prints the values.
NOTE: It is bad practice to call
mallocwithout checking if the pointer isNULL, and it is also bad practice to notfreethe memory after you’re done with it. This is just an example, and the program won’t encounter any issues on my system with allocating this space + the allocated memory will be freed automatically anyway when exiting the program. But don’t be like me - always check for errors and free your memory when you’re done using it!
I’m compiling this program with gcc -o prog prog.c -g -fPIC -O0.
NOTE: I’m running all of this on a
x86_64 Arch Linuxmachine (uname -r = 6.11.3-arch1-1). Things might be a bit different on your machine, but the general idea should be the same. NOTE: I’m using-fPICto make the code position independent, to incourage the compiler to use the PLT and GOT. I’m also using-O0to make the sure the compiler doesn’t optimize the code too much making the machine code somewhat harder to follow.-gis to have the compiler include debugging information in the binary in case we might need it.
When running the program, we get as expected:
[roeet@roeetarch ~]$ ./prog
0
1
2
3
4
5
6
7
8
9
Everything in more detail
Running objdump -d prog we get inter alia:
Disassembly of section .plt:

0000000000001020 <printf@plt-0x10>:
    1020:       ff 35 ca 2f 00 00       push   0x2fca(%rip)        # 3ff0 <_GLOBAL_OFFSET_TABLE_+0x8>
    1026:       ff 25 cc 2f 00 00       jmp    *0x2fcc(%rip)        # 3ff8 <_GLOBAL_OFFSET_TABLE_+0x10>
    102c:       0f 1f 40 00             nopl   0x0(%rax)

0000000000001030 <printf@plt>:
    1030:       ff 25 ca 2f 00 00       jmp    *0x2fca(%rip)        # 4000 <printf@GLIBC_2.2.5>
    1036:       68 00 00 00 00          push   $0x0
    103b:       e9 e0 ff ff ff          jmp    1020 <_init+0x20>

0000000000001040 <malloc@plt>:
    1040:       ff 25 c2 2f 00 00       jmp    *0x2fc2(%rip)        # 4008 <malloc@GLIBC_2.2.5>
    1046:       68 01 00 00 00          push   $0x1
    104b:       e9 d0 ff ff ff          jmp    1020 <_init+0x20>
As we can see, in this case we get 2 PLT entries - one for printf and one for malloc.
NOTE:
printf@plt-0x10is called the PLT resolver stub. I’ll get to that in just a bit. Each PLT entry has 3 instructions:
jmpto the address in the PLT stub’s.got.pltentry (ie. the resolved function address). When the linker uses lazy binding, the linker sets this address to point back to the second instruction in PLT stub itself (thepushinstruction).pushthe index of the GOT entry to the stack. This is the index of the GOT entry which contains the address of the function we want to call.jmpto the “PLT resolver stub”.
The PLT resolver stub’s purpose is calling the dynamic linkers resolver function. It contains 2 instructions (but as expected, they are different):
pushpushes a descriptor to the stack.jmpto the dynamic linker’s resolver function.
NOTE: You might’ve noticed the PLT resolver actually contains 3 instructions, but the last one is redundant - it’s just a
nopinstruction. I’m not sure why it’s there, but either way it’s not important for our purposes.
_dl_runtime_resolve
The resolver function ld.so uses is _dl_runtime_resolve which (according to the version of glibc I’m rocking) is located under sysdeps/x86_64/dl-trampoline.h.
NOTE: I found out that on my machine
_dl_runtime_resolveis actually a macro which expands to_dl_runtime_resolve_xsave. And as we can see insysdepds/x86/cpu-features.c, there are other options for_dl_runtime_resolve:
#ifdef __x86_64__
extern void _dl_runtime_resolve_fxsave (void) attribute_hidden;
extern void _dl_runtime_resolve_xsave (void) attribute_hidden;
extern void _dl_runtime_resolve_xsavec (void) attribute_hidden;
#endif
I won’t dwelve on the specifics here, but in general these xsave family of instructions are used to save full/partial state of the CPU (They have slight differences between them (hence the name difference) but nonetheless operate similarly).
I’m not going to cover all of _dl_runtime_resolve code, but it’s a relatively short procedure so I recommend looking at it if you have the time.
In general what it does is:
- Saves the state of the CPU
- calls
_dl_fixup, - restores the state of the CPU
- returns to the PLT stub.
Here’s the part we’re interested in:
	# Copy args pushed by PLT in register.
	# %rdi: link_map, %rsi: reloc_index
	mov (LOCAL_STORAGE_AREA + 8)(%BASE), %RSI_LP
	mov LOCAL_STORAGE_AREA(%BASE), %RDI_LP
	call _dl_fixup		# Call resolver.
	mov %RAX_LP, %R11_LP	# Save return value
Do the 2 mov instructions look familiar? They should - we’re copying the arguments pushed into the stack by the PLT stub + PLT resolver.
_dl_fixup
This one is a bit bulkier than _dl_runtime_resolve but hey, at least it’s in C and not assembly. (And in terms of size still nothing compared the monstrosity that dl_main is, so be gratefull!).
I highly recommend looking at the source code youself, it has a lot of comments and is quite readable. But for the lazy amongst us, here’s a short summary:
- if the target symbol is visibile calls
_dl_lookup_symbol_x(which we won’t get into detail here, but in general what it does is goes over all the loaded modules and looks up the symbol). It returns the base load address of the module and sets a pointer passed as parameter (sym) to the symbol table entry corresponding to the symbol. - gets the sym value by adding
base address + symbol offset - adds
addendif needed - if the symbol type is
STT_GNU_IFUNC, it calls the resolver function (which is the value we calculated thus far) to get the real value
NOTE:
STT_GNU_IFUNCtype means that the value calculated from the symbol isn’t the final value, but rather a function we must call to get the final value.
- (unless explicitly told not to using
_dl_bind_not) callself_machine_fixup_plt(which in the case of x86_64, is literaly one line) that sets the.got.pltentry to the value) and returns that value.
NOTE: There is also a part in
_dl_fixupwhich lets audit functions change the value being written to the.got.pltentry (I dropped it out since it’s not a core essential part of the process). If you don’t know what glibc audit functions are, here you go.
Conclusion
I hope this post helped! As always, if you have any questions, comments, clarifications or mistakes I made, please do reach out!
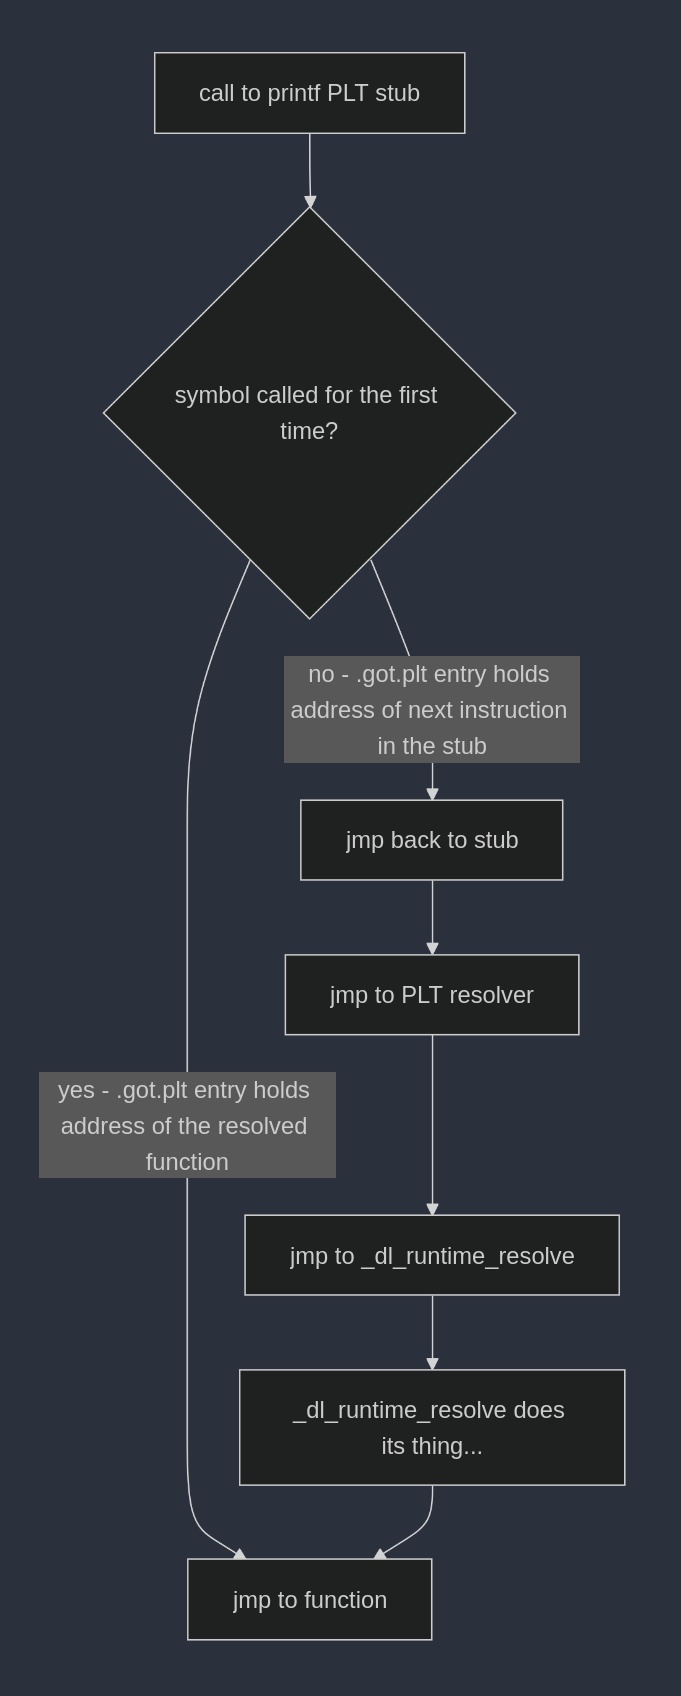
PS: I’ve realized that the flow of execution of eager vs lazy binding might be a bit confusing, so here’s a diagram to help visualize it:
Lazy binding flow chart:
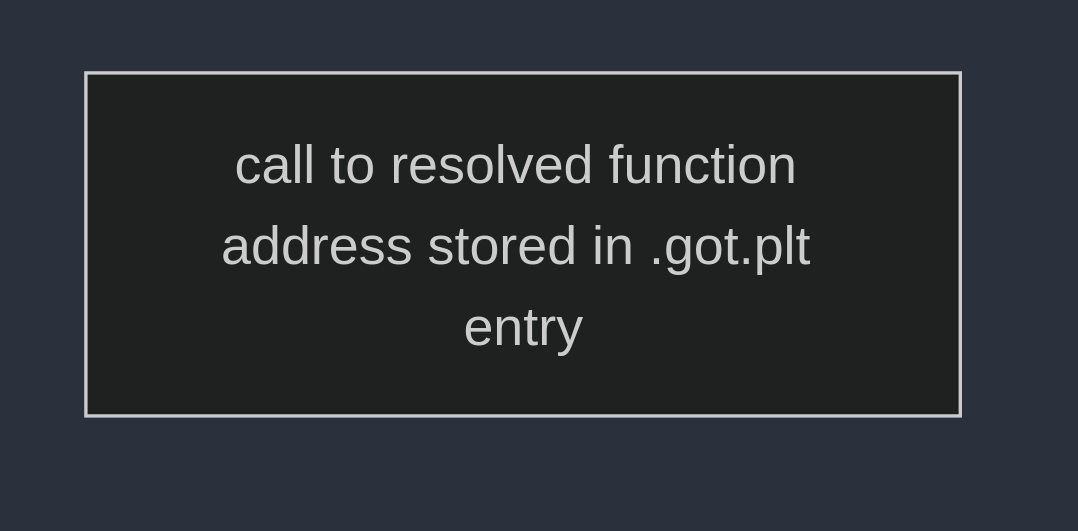
Eager binding flow chat:
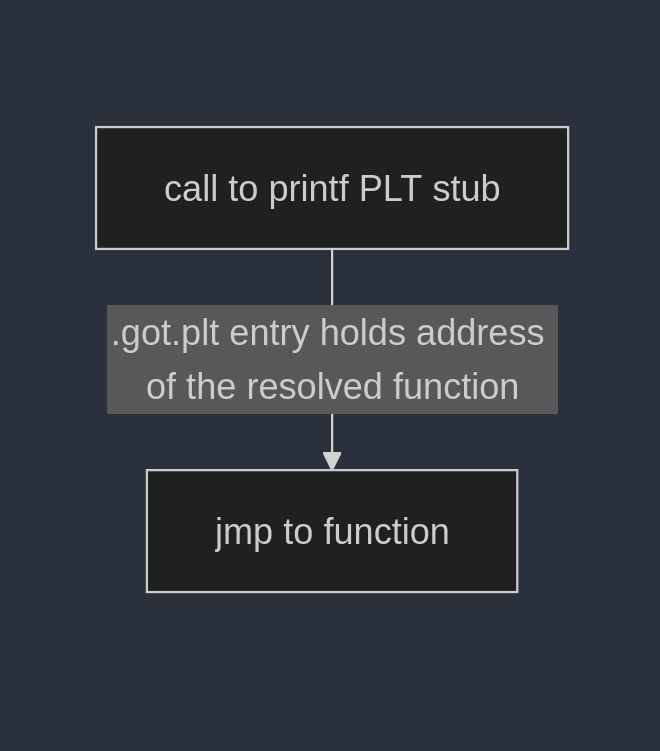
Now something I didn’t mention before, is a quite simple optimization we could have when using eager binding - we could do something called “PLT inlining”. What this essentially means is that instead of calling to the PLT just to perform another jmp to the address stored in the .got.plt entry, we could just call the .got.plt directly.
If you want to see it in action, use the -fno-plt flag when compiling the program.
Eager binding (with PLT inlining) flow chat: